




























Build Your Target Operating Model with the SAE Map
The System Automation Engagement (SAE) Map is the target operating model blueprint that aligns your workflows, customer touchpoints, and data flows before a single automation is built, preventing costly mistakes and rework.
Step Build Process
0
Key Elements
0
Journey Coverage
0
°
Revenue Blueprint
0
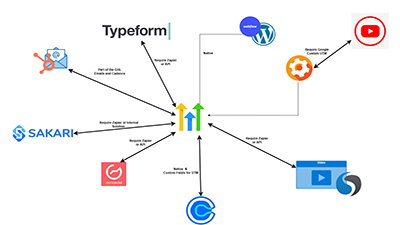
What is the System Automation Engagement Map (SAE Map)?
The SAE Map is a detailed visual blueprint that outlines how each system, process, and customer touchpoint should work together to create a seamless revenue experience. As a target operating model purpose-built for RevOps teams, it focuses on automation and integration, mapping exactly how data and workflows flow between your CRM, marketing tools, customer support platforms, and every other system in your revenue stack at every stage of the customer journey.
The result is a living blueprint your entire team can execute against. Learn how it connects to your data flow architecture and powers every automation you build.
Why Your Business Needs a Target Operating Model First
Most RevOps teams build automations and integrations before they have a clear target operating model — a defined picture of how systems, data, and people should work together at scale. The result: expensive rework, data silos, and engagement gaps that erode revenue.
The SAE Map gives your organization that blueprint before building. By collecting detailed data on current processes, customer journey stages, and business objectives, it ensures every workflow and automation you build contributes directly to growth. According to Gartner organizations with a defined target operating model reduce integration rework costs by 30 to 50 percent.
Unlike a static strategy document, the SAE Map is an executable blueprint connected directly to your centralized data hub system and your automation stack, so your target operating model becomes reality.
Where does SAE Map sit in your stack?
1
SAE Map
Map your systems, touchpoints, and engagement strategy
You are here
2
Structure Data & Attributes
Map your systems, touchpoints, and engagement strategy
3
Centralize all data into a single source of truth
4
Execute automated data flows across your connected stack
Map → Structure → Centralize → Execute
The Four Key Elements of Your SAE Map
Every SAE Map is built from four core components that together create a complete picture of how your business engages customers, from first touch to long-term retention. These elements form the foundation of any effective target operating model.
⚙️
System Interactions
Outlines exactly how each technology system — CRM, marketing automation, customer support, and billing — works together, sharing data and triggering actions based on customer behavior. No more guessing which tool owns which data.
🔄
Process Flows
Visualizes workflows for every stage of the customer journey: lead nurturing, onboarding, upsell sequences, and re-engagement. Ensures each process supports consistent, measurable engagement rather than isolated tactics.
🗺️
Touchpoint Mapping
Shows every customer interaction from initial contact through retention activities, highlighting the intended impact of each touchpoint on the overall experience. Every email, ad, demo, and follow-up has a defined purpose and outcome.
📊
Data Flow
Maps how customer data moves between your tools in real time. This is the connective tissue of your target operating model — without clean data flow, no automation delivers on its promise. See how workflow automation depends on it.
The Five Steps to Build Your SAE Map
Building a System Automation Engagement Map follows a disciplined five-step process that transforms scattered processes into a unified target operating model ready to execute.
1
Conduct a Comprehensive Analysis of Current Processes
The first step in building an SAE Map is an in-depth audit of how your business operates today. This analysis uncovers where the business is losing efficiency and where customer engagement is not reaching its potential.
- Which workflows are currently automated, and where are the opportunities for further automation?
- How is customer data stored and accessed across departments?
- Where in the customer journey does engagement drop off or become inconsistent?
2
Map the Customer Journey with Precision
An effective SAE Map requires a precise understanding of the full customer journey, from awareness and consideration through purchase, onboarding, retention, and advocacy. At each stage, different touchpoints shape the customer’s overall experience. Salesforce research confirms that businesses mapping each touchpoint see 18% faster revenue cycles on average.
- Identify Critical Touchpoints: Determine where and how customers interact with your brand at each stage.
- Define Engagement Goals: Set specific goals per stage — conversions in purchase, loyalty in retention.
- Pinpoint Pain Points: Identify friction points where customers drop off or disengage.
3
Establish Automation and Integration Points
A primary purpose of the SAE Map is to streamline automation and eliminate data silos. Automation reduces the need for manual intervention, saving time and ensuring customers receive timely, relevant communication throughout their journey.
- Set Trigger-Based Automation: Automate actions based on specific customer behaviors — abandoned cart reminders, follow-ups after support interactions.
- Ensure Data Synchronization Across Systems: Customer information flows freely between tools in real time, providing a single view of the customer.
- Minimize Redundancy: Remove repetitive manual tasks so teams can focus on strategic activities.
4
Design the SAE Map Blueprint
With analysis, journey mapping, and automation points defined, it’s time to create the actual SAE Map blueprint — a detailed visual representation that aligns customer engagement with business objectives, ensuring no element of the customer journey is left unaddressed.
- Engagement Triggers: Define specific triggers for each customer action — email follow-ups after downloads, re-engagement messages for inactive users.
- Customer Data Integration Points: Specify where data needs to flow between systems and ensure seamless data movement.
- Touchpoint Sequence: Arrange touchpoints in a logical order so each engagement builds on the previous one for a natural journey progression.
- KPIs and Metrics: Attach specific metrics to each part of the journey to measure success and adjust based on performance.
5
Implement, Monitor, and Refine Continuously
Once the SAE Map is finalized, implementation happens in phases — testing each step and making adjustments as needed. The target operating model your SAE Map defines evolves as your business and customer base grow.
- Roll Out in Phases: Introduce different parts of the SAE Map gradually, allowing teams to adapt and troubleshoot any issues.
- Monitor and Measure: Regularly track KPIs associated with each journey step to ensure implementation is driving the intended results.
- Refine Based on Data: Use real-time data to adjust campaigns, update automation rules, or refine messaging based on what works.
Why You Need the SAE Map
Creating and implementing an SAE Map delivers five measurable business outcomes that directly improve revenue performance and customer satisfaction.
01
Eliminating Data Silos
By integrating systems and automating data flow, the SAE Map ensures all customer information is readily accessible, providing a unified view of each customer across every tool in your stack.
02
Enhanced Customer Experience
Customers experience a consistent, cohesive journey with personalized messaging and timely follow-ups that build trust and encourage loyalty at every stage from first touch to renewal.
03
Increased Operational Efficiency
Automation reduces manual effort, freeing team resources for high-value activities while ensuring no touchpoint is missed. Your revenue operations scales without proportional headcount growth.
04
Alignment with Business Goals
The SAE Map keeps all engagement efforts aligned with overarching business objectives, ensuring every campaign contributes to growth and customer satisfaction rather than just activity metrics.
05
Data-Driven Decision Making
The SAE Map includes KPIs and metrics at every step, enabling teams to make informed adjustments based on actual performance data.
Ready?
Get Your Free SAE Report
Let Fruition’s Data Flow Specialist analyze your current state and map the path to your target operating model.
SAE Map vs. Traditional Enterprise Architecture
Traditional enterprise architecture frameworks define systems and structures. The SAE Map connects architecture to execution, automation, and measurable revenue outcomes. For B2B organizations implementing a target operating model, this distinction is critical.
| Capability | Traditional EA / TOM Framework | Fruition SAE Map |
|---|---|---|
| Visual System Blueprint | High-level diagrams | ✓ Executable, tool-specific mapping |
| Customer Journey Integration | ✗ Usually separate | ✓ Built into every step |
| Automation Trigger Mapping | ✗ Not included | ✓ Defined for each touchpoint |
| Revenue Alignment (KPIs) | At project level | ✓ At every journey stage |
| Data Flow Architecture | Conceptual | ✓ Tool-specific, real-time |
| Phased Implementation Guide | ✗ Rarely included | ✓ Built into delivery |
| RevOps-Specific Framework | ✗ General IT/business focus | ✓ Designed for revenue teams |
Common Questions About the SAE Map
What is a System Automation Engagement Map (SAE Map)?
The SAE Map is a detailed visual blueprint that outlines how each system, process, and customer touchpoint should work together. It focuses on automation and integration, mapping exactly how data and workflows flow between your CRM, marketing tools, customer support platforms, and every other system in your revenue stack at every stage of the customer journey.
How is the SAE Map different from a traditional target operating model?
A traditional target operating model defines business structure at a high level. The SAE Map specifies exactly how each system, automation, and touchpoint executes that vision, with built-in KPIs and data flow architecture that keeps every engagement effort aligned to revenue goals. It is a target operating model built for RevOps execution.
What are the four key elements of the SAE Map?
(1) System Interactions — how each tech system triggers actions based on customer behavior; (2) Process Flows — workflow visualization for each journey stage; (3) Touchpoint Mapping — every customer interaction from first contact through retention; and (4) Data Flow — how customer data moves between all tools in real time.
Who is the SAE Map designed for?
The SAE Map is designed for B2B organizations and RevOps teams scaling their automation infrastructure and needing a clear engagement architecture before building. It is particularly valuable for companies implementing ERP systems, undergoing CRM migrations, or building out their first structured RevOps framework.
How does the SAE Map connect to QDF and CDHS?
The SAE Map is the strategic design layer. Once your SAE Map is built, CDHS centralizes all data into a single source of truth, and Quick Data Flow (QDF) executes the data flows it defines. Together they form Fruition’s complete revenue operations architecture: Map, Structure, Centralize, Execute.
How long does it take to build an SAE Map?
Timeline varies based on the complexity of your tech stack and the number of customer journey stages involved. Fruition typically delivers an initial SAE Report within 1 to 2 weeks, which forms the foundation for a full SAE Map build. Get your free SAE Report to see your specific scope.
Ready to Design Your Target Operating Model?
Get your free SAE Report and let Fruition’s Data Flow Specialist map the engagement architecture your revenue team needs.